Configurer motd (message of the day)How to configure motd (message of the day)
Ce post explique comment configurer le serveur ssh pour qu’il affiche un message du jour mis à jour régulièrement et comment personnaliser ce message.
Installation de base
On commence par installer les paquets :
sudo apt-get install motd-update landscape-common
Le premier paquet permet la génération d’un message personnalisé à chaque login, le second permet d’y inclure des informations système. Pour activer l’affichage des informations système, faire
sudo dpkg-reconfigure landscape-common
et choisir “run info on every login”.
Configuration du serveur ssh
Pour que motd-update permette l’activation d’un nouveau message à chaque démarrage, il faut autoriser l’exécution de pam au login. Si vous utiliser une connexion uniquement par clé publique/privée comme décrit dans ce post, il faut fixer les paramètres du fichier /etc/ssh/sshd_config comme suit :
PrintMotd no
PasswordAuthentication no
ChallengeResponseAuthentication no
UsePAM yes
Personnalisation du message du jour
Les scripts exécutés (dans l’ordre alphabétique) pour l’affichage du message du jour sont dans /etc/update-motd.d. Pour désactiver l’un des scripts, faire simplement
sudo chmod -x LE-SCRIPT
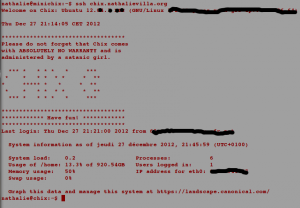
Pour des exemples de configuration, je vous conseille de regarder ce post ou ce post. Voici mon message of the day :
Sécurisation du serveur apache<
Ce post décrit brièvement quelques précautions basiques à prendre pour sécuriser votre serveur apache. En particulier, il décrit comment utiliser le module mod_security pour installer une liste noire d’IP.
Sécurisation via les fichiers de configuration
Le dossier /etc/apache2/sites-available/ contient les dossiers de configuration des hôtes et des hôtes virtuels apache (voir les posts : installation d’un serveur apache et créer un hôte virtuel). On édite ces fichiers pour ajouter les directives suivantes :
-
Empêcher le serveur de lire le répertoire à la racine du serveur
Order Deny,Allow
Deny from all
Options None
AllowOverride None
-
Empêcher le serveur de lire les fichiers
.htaccessAccessFileName .httpdoverride Order allow,deny Deny from all Satisfy All
En savoir plus : Documentation ubuntu francophone « sécuriser un serveur apache »
Sécurisation via le module modsecurity
ModSecurity est un module d’Apache spécialisé dans la sécurité qui joue le rôle de pare-feu applicatif :
 (image tux-planet.fr).
On installe le module par :
sudo apt-get install libapache2-modsecurity
Le fichier de configuration du module se trouve dans le dossier /etc/modsecurity/ en version “recommandée” (mais non active). On commence par copier le fichier de configuration basique :
cp modsecurity.conf-recommended modsecurity.conf
puis on édite modsecurity.conf pour ajouter quelques règles élémentaires :
-
Activer le blocage des requêtes détectées par les règles mises en place
SecRuleEngine On
(si l’option est laissée à DetectionOnly, le modules se contentera de journaliser les erreurs rencontrées.
-
Ajout d’une signature personnalisée(pour empêcher l’utilisation de la description de votre configuration à des fins d’attaque)
SecServerSignature "Tuxette OS"
Pour que cette règle soit active, il faut de plus éditer le fichier
/etc/apache2/conf.d/securityet choisir l’optionServerTokens="Full".</li> -
Création d’une liste noire (pour bloquer les IP indésirables : je pêche mes IP indésirables via l’utilisation du plugin wordpress “Limit Login Attempts”)
SecAction “phase:1,pass,nolog,setvar:tx.remote_addr=/%{REMOTE_ADDR}/”
SecRule TX:REMOTE_ADDR “@pmFromFile blacklist.txt” “deny,status:403
Une fois cette règle ajoutée, il faut créer un fichier/etc/modsecurity/blackllist.txtcontenant les IPs entourées du caractère “/” :</p>/1.2.3.4/
</ol>
- Documentation Ubuntu francophone sur “modsecurity” ;
- Tutoriel modsecurity sur tux-planet ;
- Manuel de référence modsecurity.
Enfin, le module est activé par :
sudo a2enmod mod_security
sudo service apache2 reload
et les logs peuvent être consultés dans le fichier /var/log/apache2/modsec_audit.log. On peut créer un deuxième fichier de log plus condensé avec l’activation des lignes suivantes dans le fichier modsecurity.conf :
SecDebugLog /var/log/apache2/modsecurity_debug.log
SecDebugLogLevel 0
.
En savoir plus :
</div>
Toulouse – Capitole du Libre
Le Capitole du Libre est un événement consacré au Logiciel Libre en particulier, et au libre en général. Il est orienté à la fois vers le grand public et le public spécialisé. L’édition 2012 du Capitole du Libre aura lieu les 24 et 25 novembre à l’ENSEEIHT, à Toulouse.

Voir le site web : http://www.capitoledulibre.org/2012
Fouille de données sur mes amis facebookData mining on my facebook friends
Uniquement en anglais…
This post is dedicated to my students for whom I put a great deal of efforts into trying to push them toward the fantastic R world… I’ve found an unlimited source of applications into crawling my facebook network. This post explains how to gather together data coming from facebook and gives a few hints about how to analyze your friends’ mutual friendship network and main interests.
Collecting the data from facebook
To do so, you first need to:
- log in to your facebook account and get an access token on the facebook graph API (don’t forget to ask extended permissions to be able to collect your friends’ data)
-
use the function
extract.FBNetprovided at the end of this post to extract your friends’ mutual friendship network and main interests; this can be done by the following R command lines:token = "AAACEdEose0c..." # paste you res = extract.FBNet(token)
Then
res$networkis the network andres$infocontains your friends’ likes, favorite music, movies and books. Further information about what can be collected using the facebook token is provided here (for instance, you can also collect your friends’ last posts and comments).</li> </ul>What kind of music do my friends listen to?
res$infois a list having for length the number of my friends. Each element of the list contains-
idthe facebook identifier; -
namethe friend’s name; -
musicthe friend’s favorite musicians; -
moviesthe friend’s favorite movies; -
booksthe friend’s favorite books; -
likesthe friend’s “like” tags.
In the following, I study my friends’ favorite music (the last command is from the package ggplot2):
# Collect favorite musicians for each friends from info
all.music = lapply(res$info, function(x) x$music)
length(unique(unlist(all.music))) # 811 different values
sum(table(unlist(all.music))==1) # 83 musicians are only cited once
# Let's see which musicians are the most popular
music.freq = sort(table(unlist(all.music)), decreasing=T)
best.music.freq = names(music.freq)[music.freq>4]
best.music = substr((unlist(all.music))[unlist(all.music)%in%best.music.freq],1,15) # to shorten the names
num = as.numeric(as.factor(best.music))
best.music = data.frame("music"=best.music,"id"=factor(num))
qplot(id, data=best.music, geom="bar", fill=music)+labs(title="My friends' favorite music", xlab="")
which gives the following chart
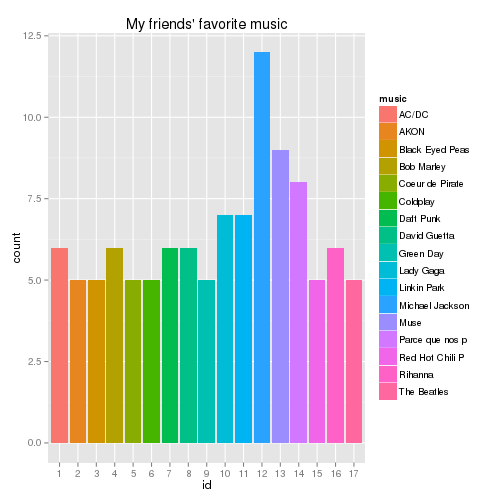
OK, so Vincent G. it seems that you spoiled these data… Also, it’s so very interesting to note that 8 of my friends have “Parce que nos plus belles conneries deviennent nos plus beaux souvenirs. =)” as one of their favorite music (I don’t translate it in English, but surely GIYF). Btw, I have the names… shame on you, guys!At this point, I was very disappointed that The Cure were not in the most popular musicians: what kind of foolish friends do I have?! I finally checked it directly:
V(res$network)$name[unlist(lapply(all.music,function(x) length(grep("Cure", x)) != 0))]and luckily found out that Matthieu V and Kevin M can come with me to the next gig.
Finally, let’s see who is having the largest number of favorite musicians in her/his profile.
# Number of favorite musicians for each friend
music.addict = unlist(lapply(all.music, function(x) length(x)))
summary(music.addict)
#    Min. 1st Qu.  Median    Mean 3rd Qu.    Max.
#   0.000   0.000   2.000   7.211   6.500  84.000

# Who is having the largest number of favorite musicians in her/his profile?
head(sort(music.addict,decreasing=T))
# [1] 84 81 79 71 55 45
V(res$network)[music.addict%in%c(84,81,79,71,55,45)]
# Vertex sequence:
# [1] "Matthieu V"  "fabien P"     "Clement D" "Paul C"
# [5] "Abou E"        "Alexia A"
One fourth of my friends have no favorite musician on their profile but… Alexia A, tell me, how can you have 84 favorite musicians? 😉
The same analysis with books gives:
summary(book.addict)
#    Min. 1st Qu.  Median    Mean 3rd Qu.    Max.
#  0.0000  0.0000  0.0000  0.7415  0.0000 22.0000
More than half of my friends have no favorite book???!! (ok so do I, at least on facebook…)
Network analysis together with basic information on favorite music and books
First have a quick glance at the network’s main characteristics (the package igraph is required to handle graph)
summary(res$network)
# IGRAPH UN-- 147 547 --
# attr: id (v/c), name (v/c), initials (v/c)
which means that my network contains 147 friends with attributes id (the facebook id), name (their names) and initials (their initials). Other numerical summaries are provided by igraph, such as:
graph.density(res$network) # Number of connections between friends divided by the number of possible connections
# [1] 0.05097381
transitivity(res$network) # Probability that two friends who share a common relationship, except me, are also friends
# [1] 0.5661737
Some of my friends are disconnected from what is called the largest connected component (i.e., the largest subgraph that is connected; so, yes, Myriam V and Célia E, you’re not in…)
# connected component analysis
connected.comp = clusters(res$network)
connected.comp$csize
# [1] 102   3   3  13   1   2   1   1   1   2   1   1   2   1   1   1   2   2   2
# [20]   1   1   1   1   1
# The largest connected component contains 102 friends.

# Throwing away unconnected people (goodbye my dear sis'...)
lcc = induced.subgraph(res$network, connected.comp$membership==1)
lcc
# IGRAPH UN-- 102 523 --
# + attr: id (v/c), name (v/c), initials (v/c)
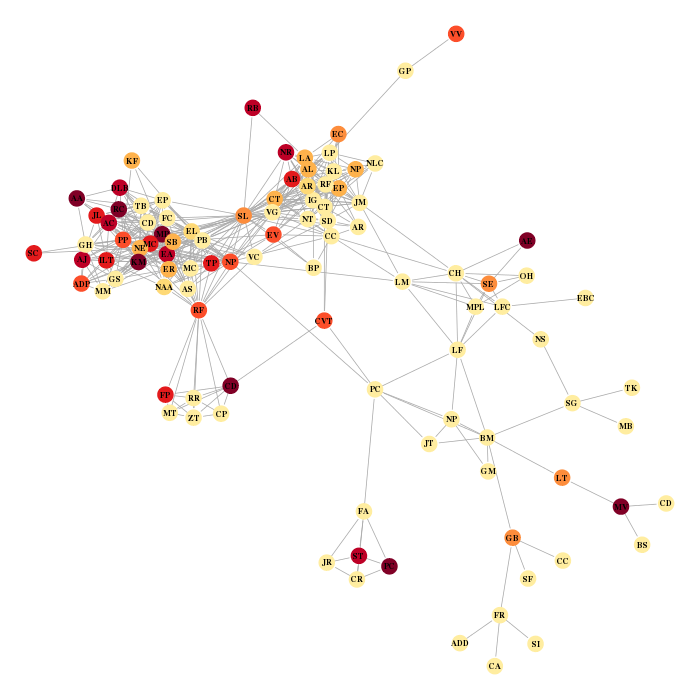
Finally I display the graph with the nodes colored according to the number of favorite musicians mentioned on each profile and labeled with my friend’s initials.
the.layout = layout.fruchterman.reingold(res$network)
the.colors = brewer.pal(9,"YlOrRd")
v.col = the.colors[1+cut(music.addict,c(-0.1,2,quantile(music.addict,probs=seq(0.6,1,length=7))),labels=F)][match(V(lcc)$name, V(res$network)$name)]
par(mar=c(0,0,0,0))
plot(lcc, layout=the.layout[match(V(lcc)$name, V(res$network)$name),], vertex.size=5, vertex.color=v.col, vertex.frame.color=v.col, vertex.label=V(lcc)$initials, vertex.label.cex=0.7, vertex.label.font=2, vertex.label.color="black")
which gives the two following charts (the red one is for music, the blue one for books… !)
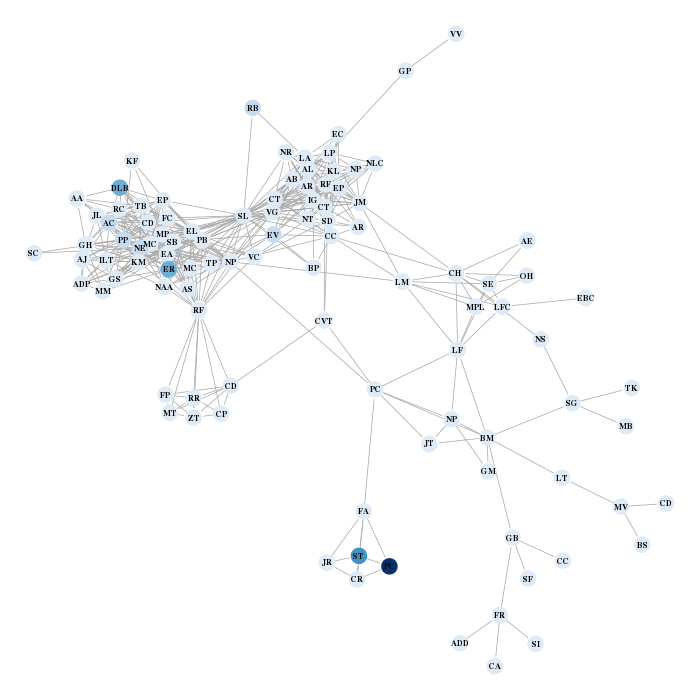
Paul C., would you tell me what you’re doing except reading and listening to music?Functions to collect your friends’ data from facebook
The library RCurl, rjson, igraph are required to use these functions:
facebook =  function( path = "me", access_token = token, options) {
	if( !missing(options) ){
		options = sprintf( "?%s", paste( names(options), "=", unlist(options), collapse = "&", sep = "" ) )
	} else {
		options = ""
	}
	data = getURL( sprintf( "https://graph.facebook.com/%s%s&access_token=%s", path, options, access_token ) )
	fromJSON( data )
}

extract.FBNet = function(token) {
	# outputs: igraph network ("network") and information on friends ("info" which is a list)

	# first, gather friends' list
	friends = facebook(path="me/friends", access_token=token)

	# basic friends' description
	friends.id = sapply(friends$data, function(x) x$id)
	# extract names
	friends.name = sapply(friends$data, function(x) iconv(x$name,"UTF-8","ASCII//TRANSLIT"))
	# short names to initials
	initials = function(x) {paste(substr(x,1,1), collapse="")}
	friends.initial = sapply(strsplit(friends.name," "), initials)
	# final data frame
	friends = data.frame("id"=friends.id, "name"=friends.name, "initial"=friends.initial, stringsAsFactors = FALSE)

	# Information on friends
	friends.info = list()
	for (ind in 1:length(friends.id)) {
		print(paste("information for friend number",ind,"..."))
		friends.info[[ind]] = list()
		friends.info[[ind]]$id = friends$id[ind]
		friends.info[[ind]]$name = friends$name[ind]
		tmp = facebook(path=paste(friends$id[ind],"/likes",sep=""))
		friends.info[[ind]]$likes = unique(unlist(lapply(tmp$data, function(x) x$name)))
		tmp = facebook(path=paste(friends$id[ind],"/books",sep=""))
		friends.info[[ind]]$books = unique(unlist(lapply(tmp$data, function(x) x$name)))
		tmp = facebook(path=paste(friends$id[ind],"/music",sep=""))
		friends.info[[ind]]$music = unique(unlist(lapply(tmp$data, function(x) x$name)))
		tmp = facebook(path=paste(friends$id[ind],"/movies",sep=""))
		friends.info[[ind]]$movies = unique(unlist(lapply(tmp$data, function(x) x$name)))
	}

	# friendship relation matrix
	N = length(friends.id)
	friendship.matrix = matrix(0,N,N)
	for (i in 1:N) {
		# For each friend, find the mutual friends to add edges to the graph
		tmp = facebook(path=paste("me/mutualfriends", friends.id[i], sep="/") , access_token=token)
		mutualfriends = sapply(tmp$data, function(x) x$id)
		friendship.matrix[i,friends.id %in% mutualfriends] = 1
	}
	colnames(friendship.matrix) = friends.id
	rownames(friendship.matrix) = friends.name

	mygraph = graph.adjacency(friendship.matrix,mode="undirected",add.colnames="id",add.rownames="name")
	V(mygraph)$initials = friends$initial

	list("network"=mygraph, "info"=friends.info)
}
</div> -
Utiliser un programme Java dans R grâce au package rJavaUse a Java program in R thanks to the rJava package
Ce tutoriel n’existe qu’en anglais…
In this post, I explain how to use a Java program directly in
R. As an example, I will use the Java program, clustering.jar, available here (jar file and documentation) to cluster the vertices of my facebook network (or, more precisely, of its largest connected component): the example dataset can be downloaded here (and was extracted as explained in this post found on R blogger. This tutorial was made possible thanks to the help of Damien (also known as bl0b) who explained me how to use the rJava package.
This post will show you how to cluster a graph and how to display it accordingly to the clustering:
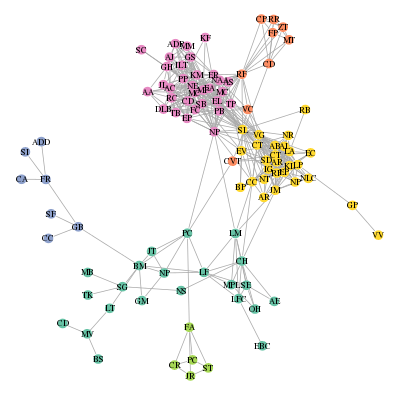
I hope that all of my (facebook) friends can find themselves on this picture and are happy with their group… 😉
Pre-requisites
-
What you need to use Java in R is a first a proper Java environment installed on your computer. If you are a linux or a Mac OS X user, you can check it by using the command
java -version
which should give you something like
java version "1.6.0_24"
OpenJDK Runtime Environment (IcedTea6 1.11.4) (6b24-1.11.4-1ubuntu0.12.04.1)
OpenJDK Server VM (build 20.0-b12, mixed mode)
If you are a Windows user, well…, GIYF (but not me);</li>
- also, you need the R package rJava to be installed so that R can use the Java environment;
- finally, if you want to be able to run my example, you also need the R package igraph to handle graphs in R. </ul>
How does it work?
First, the function
.jinit()
is used to initialize the Java Virtual Machine. It has to be called before any other function of the package. Then,
.jaddClassPath('clustering.jar')
adds the jar file clustering.jar to the class path. Finally, the function J can be used to call a Java method. To be able to see which Java class reference you have to pass to this function, you can use the following command line in a terminal (if you are a linux or a Mac OS X user)
jar -t clustering.jar
which gave me
META-INF/MANIFEST.MF
org/apiacoa/graph/clustering/DoCluster.class
org/apiacoa/graph/clustering/GraphClusteringParameters.class
org/apiacoa/graph/clustering/SignificanceMergePriorizer.class
org/apiacoa/graph/clustering/MergePriorizer.class
org/apiacoa/graph/Graph.class
gnu/trove/TIntObjectHashMap.class
...
giving me a clue (well, really, giving Damien a clue) about the fact that the main class might be called ‘org.apiacoa.graph.clustering.DoCluste‘. Hence, I can use this jar file in R by
J('org.apiacoa.graph.clustering.DoCluster', 'main', c(...))
where c(...) is the list of parameters that has to be passed to the jar program, as described in the documentation of the program:
J('org.apiacoa.graph.clustering.DoCluster', 'main', c('-graph', graph.file, '-part', tmp.part, '-recursive', '-mod', tmp.mod, '-random', '100'))
for instance.
Finally, how to use it?
In my case, the jar file takes as an input a text file (containing the edge list of the graph, graph.file in the example above) and produces one or two text files (containing the clustering and the value of the modularities tmp.part and tmp.mod in the example above). So I used it as follows:
-
I extracted the list of edges using the function
get.edgelist(igraph) and exported it in a text file (in the working directory); -
I created one or two temporary files names using the function
tempfile()to export the results; -
I read the temporary files from R and deleted them using the function
unlink.
which finally gave me the following function to use most of the options of the initial jar file directly in an R function:
## Requires rJava, igraph
do.hierarchical.clustering = function(a.graph, reduction=0.25, verbose=0, debug=0, random=NULL, recursive=FALSE, termination='significance', minsize=4, recrandom=50, weights=NULL) {
  if (is.null(weights)) {
    el = get.edgelist(a.graph)
  } else {
    el = data.frame(get.edgelist(a.graph),get.edge.attribute(a.graph,weights))
  }
  write.table(el,row.names=FALSE,col.names=FALSE,file='tmp.el.txt')
  tmp.part = tempfile()

  .jinit()
  .jaddClassPath('clustering.jar')
  if (is.null(random)) {
    if (recursive) {
       J('org.apiacoa.graph.clustering.DoCluster', 'main', c('-graph', 'tmp.el.txt', '-part', tmp.part, '-reduction', reduction, '-verbose', verbose, '-debug', debug, '-recursive', '-termination', termination, '-minsize', minsize, '-recrandom', recrandom))
    } else {
      J('org.apiacoa.graph.clustering.DoCluster', 'main', c('-graph', 'tmp.el.txt', '-part', tmp.part, '-reduction', reduction, '-verbose', verbose, '-debug', debug))
    }
  } else {
    tmp.mod = tempfile()
    if (recursive) {
       J('org.apiacoa.graph.clustering.DoCluster', 'main', c('-graph', 'tmp.el.txt', '-part', tmp.part, '-reduction', reduction, '-verbose', verbose, '-debug', debug, '-random', random, '-mod', tmp.mod, '-recursive', '-termination', termination, '-minsize', minsize, '-recrandom', recrandom))
    } else {
      J('org.apiacoa.graph.clustering.DoCluster', 'main', c('-graph', 'tmp.el.txt', '-part', tmp.part, '-reduction', reduction, '-verbose', verbose, '-debug', debug, '-random', random, '-mod', tmp.mod))
    }
  }

  mod = NULL
  part = read.table(tmp.part,row.names=1)
  part = part+1
  names(part) = paste('h',1:ncol(part),sep='')
	unlink(tmp.part)
  if (!is.null(random)) {
    mod = read.table(tmp.mod,stringsAsFactors=FALSE)
    unlink(tmp.mod)
    names(mod) = c('modularity','type')
  }
  unlink('tmp.el.txt')
  list('part'=part,'mod'=mod)
}
I can be used to cluster the vertices of my facebook network (the igraph object is called fbnet in this Rdata file; it models an unweighted graph so the argument weights in the R function must be equal to NULL) by
# basic clustering
res1 = do.hierarchical.clustering(fbnet, verbose=1)
# basic clustering with significance test
res2 = do.hierarchical.clustering(fbnet, verbose=1, random=100)
# hierarchical clustering with significance test (results in a hierarchy with two levels)
res3 = do.hierarchical.clustering(fbnet, random=100, recursive=TRUE, recrandom=100)
The last clustering can be interpreted by
by(res3$mod$modularity,res3$mod$type,max)
res3$mod$type: Original
[1] 0.5307591
-------------------------------------------------------------------------------------
res3$mod$type: Random
[1] 0.2525655
(showing that the clustering is actually significant compared to a random graph with similar a degree distribution) and
library(RColorBrewer)
my.pal = brewer.pal(8,"Set2")
par(mar=rep(0,4))
plot(fbnet,layout=layout.fruchterman.reingold, vertex.size=5, vertex.color=my.pal[res3$part[match(V(fbnet)$name,rownames(res3$part)),1]], vertex.frame.color=my.pal[res3$part[match(V(fbnet)$name,rownames(res3$part)),1]], vertex.label=V(fbnet)$initial, vertex.label.color="black", vertex.label.cex=0.7)
that displays the graph as shown at the beginning of this post.
</div>
