Construire une interface utilisateur simple avec RGtk2Build a simple GUI with RGtk2
This post is a very basic introduction to the RGtk2 package which provides facilities in the R language for programming graphical interfaces using Gtk, the Gimp Tool Kit.
Some of my students were smart enough to program a script that takes as input a numerical variable and gives as outputs standard numerical statistics requested by the teachers for their statistics projects. Taking this script as an example (thank you Nicolas and Arthur Padawan for sending me your scripts), I describe how to create a GUI interface that takes as an input the name of a CSV data file and pop up a window with the most standard numerical statistics for the numerical variables included in the data file. The GUI interface also allows the user to save the results in a CSV file.
Required
To make all this work, you need:
- three R libraries: RGtk2 (of course, as this tutorial is about using this package), e1071 (required for the calculation of Kurtosis and skewness indexes) and ineq (for the calculation of Gini index)
- the “WhatMyTeacherWants” script, that all my students should have for their statistics project
WhatMyTeacherWants = function(x){
	res = c(
		round(mean(x, na.rm=TRUE), digits=2),
		round(median(x, na.rm=TRUE), digits=2),
		round(min(x, na.rm=TRUE), digits=2),
		max(x, na.rm=TRUE),
		max(x, na.rm=TRUE)-min(x, na.rm=TRUE),
		round(sd(x, na.rm=TRUE)),
		round(kurtosis(x, type=1,na.rm=TRUE), digits=2),
		round(skewness(x, type=1, na.rm=TRUE), digits=2),
		round(mean(x)/sd(x), digits=2),
		round(quantile(x,probs=c(0.25,0.75), na.rm=TRUE), digits=2),
		round(ineq(x),2))
	names(res) = c("mean","median","min","max","range","sd","kurtosis","skewness","variation","1st quantile","3rd quantile","gini")
	res
}
- the example data file (that is actually the famous iris dataset).
Create the input window
First step is to create the input window with data file information and options for choosing to save (or not) results:
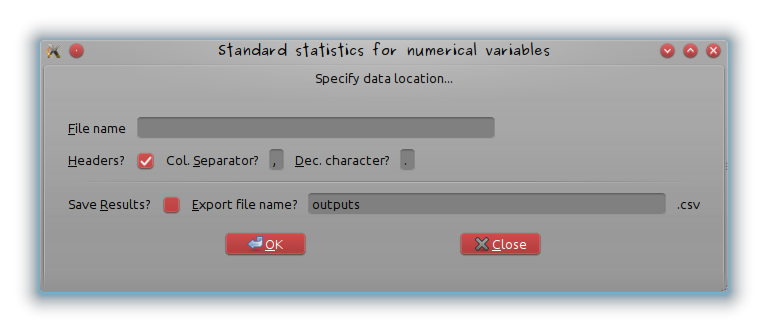
First the window is created and its name added:
# Create window
window = gtkWindow()
# Add title
window["title"] = "Standard statistics for numerical variables"
Then, even if this is not mandatory (it’s prettier), a frame is inserted in the window
# Add a frame
frame = gtkFrameNew("Specify data location...")
window$add(frame)
A vertical container is inserted in the frame so that several widgets can be added and for every widget line, a horizontal container is created and added to the vertical container:
# Create vertical container for file name entry
vbox = gtkVBoxNew(FALSE, 8)
vbox$setBorderWidth(24)
frame$add(vbox)
# Add horizontal container for every widget line
hbox = gtkHBoxNew(FALSE, 8)
vbox$packStart(hbox, FALSE, FALSE, 0)
The first element of the first line is a label “Filename” and the second element of the first line is a entry box where the user will write its file’s name (and directory if needed). The entry is given the name filename that will be passed to the program when clicking on “OK” and is accessed by using “Alt+F” (look at underscored F; it’s done by the function gtkLabelNewWithMnemonic and the attribute setMnemonicWidget). The number of characters of the text field is limited to 50.
label = gtkLabelNewWithMnemonic("_File name")
hbox$packStart(label,FALSE,FALSE,0)
# Add entry in the second column; named "filename"
filename = gtkEntryNew()
filename$setWidthChars(50)
label$setMnemonicWidget(filename)
hbox$packStart(filename,FALSE,FALSE,0)
The following lines are almost the same with checkboxes (that can be set to “check” by default using the option active) and default value for the text fields set by the option setText
# Add an horizontal container to specify input file options
# are headers included in the file?
hbox = gtkHBoxNew(FALSE,8)
vbox$packStart(hbox, FALSE, FALSE, 0)
label = gtkLabelNewWithMnemonic("_Headers?")
hbox$packStart(label,FALSE,FALSE,0)
headersEntry = gtkCheckButton()
headersEntry$active = TRUE
hbox$packStart(headersEntry,FALSE,FALSE,0)
label$setMnemonicWidget(headersEntry)

# are headers included in the file?
label = gtkLabelNewWithMnemonic("Col. _Separator?")
hbox$packStart(label,FALSE,FALSE,0)
sepEntry = gtkEntryNew()
sepEntry$setWidthChars(1)
sepEntry$setText(",")
hbox$packStart(sepEntry,FALSE,FALSE,0)
label$setMnemonicWidget(sepEntry)

# what's the character used for decimal points?
label = gtkLabelNewWithMnemonic("_Dec. character?")
hbox$packStart(label,FALSE,FALSE,0)
decEntry = gtkEntryNew()
decEntry$setWidthChars(1)
decEntry$setText(".")
hbox$packStart(decEntry,FALSE,FALSE,0)
label$setMnemonicWidget(decEntry)

# Add separator
vbox$packStart(gtkHSeparatorNew(), FALSE, FALSE, 0)

# Add two horizontal containers to check if the results have to be exported in a file and if so, to specify the file's name
hbox = gtkHBoxNew(FALSE,8)
vbox$packStart(hbox, FALSE, FALSE, 0)
label = gtkLabelNewWithMnemonic("Save _Results?")
hbox$packStart(label,FALSE,FALSE,0)
toSave = gtkCheckButton()
hbox$packStart(toSave,FALSE,FALSE,0)
label$setMnemonicWidget(toSave)
label = gtkLabelNewWithMnemonic("_Export file name?")
hbox$packStart(label,FALSE,FALSE,0)
exportFileName = gtkEntryNew()
exportFileName$setWidthChars(50)
exportFileName$setText("outputs")
hbox$packStart(exportFileName,FALSE,FALSE,0)
label$setMnemonicWidget(exportFileName)
label = gtkLabel(".csv")
hbox$packStart(label,FALSE,FALSE,0)
The windows ended with buttons: “OK” is used to call WhatMyTeacherWants on the numerical variables of the data frame and “Close” to quit the GUI. It’s done by the function gSignalConnect whose last argument is the application called when clicking.
# Add button
the.buttons = gtkHButtonBoxNew()
the.buttons$setBorderWidth(5)
vbox$add(the.buttons)
the.buttons$setLayout("spread")
the.buttons$setSpacing(40)
buttonOK = gtkButtonNewFromStock("gtk-ok")
gSignalConnect(buttonOK, "clicked", performStatistics)
the.buttons$packStart(buttonOK,fill=F)
buttonCancel = gtkButtonNewFromStock("gtk-close")
gSignalConnect(buttonCancel, "clicked", window$destroy)
the.buttons$packStart(buttonCancel,fill=F)
The performStatistics function
This function, called by clicking on “OK”, should:
- import the data from the specified file;
- search for numerical variables in this data and return an error message if none of the variable is numerical
-
run
WhatMyTeacherWantson numerical variables - print the results on a new window. This new window has two buttons: one, “OK”, is used to come back to the previous window and the second one, to definitively quit the GUI
On the iris dataset example, this gives
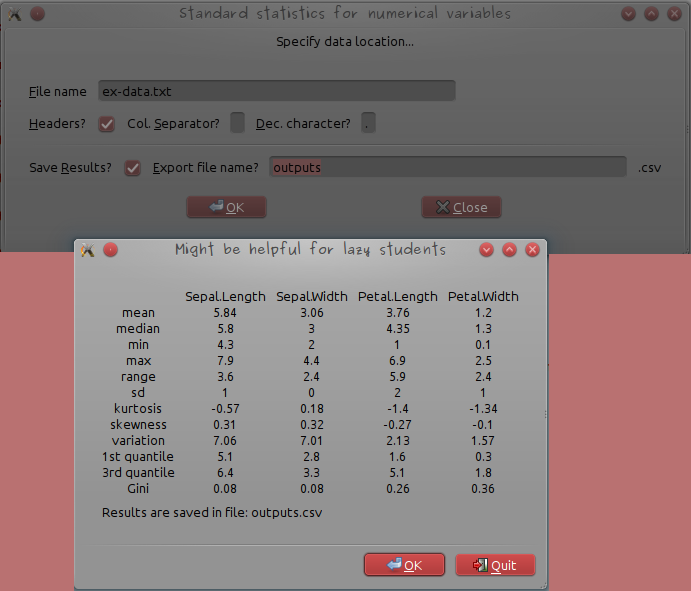
where the example data file’s name ex-data.txt was written (the file is located in the working directory), the column seperator changed to ” ” (white space) and the “Save results?” checkbox activated before the “OK” button was clicked. The results are given in a simple table and an additional message indicating that they have been saved, is also printed.
The dialog box is made by
dialog = gtkDialogNewWithButtons("Might be helpful for lazy students",window, "modal","gtk-ok", GtkResponseType["ok"],"gtk-quit", GtkResponseType["cancel"])
that contains the window’s title “Might be helpful for lazy students”, the parent window’s name “window”, the option “modal” meaning that the machine will wait for the user’s answer (“OK” or “quit”), and the buttons that will be displayed at the end of the box. Actions corresponding to these buttons are specified by
response = dialog$run()
# Return to previous window
if (response == GtkResponseType["ok"]) {
	dialog$destroy()
}
# Quit all windows
if (response == GtkResponseType["cancel"]) {
	dialog$destroy()
	window$destroy()
}
The full code of the function performStatistics is in the file GraphicalInterface.R of the tutorial material (tar.gz archive that contains the WhatMyTeacherWants function, the example data file and the GUI code, written as a function). The function performStatistics has to be sourced before the function gSignalConnect(buttonOK, "clicked", performStatistics) of the main windows is called. Once the files unpacked, the script can be tested by:
library(RGtk2)
library(e1071)
library(ineq)
source("WhatMyTeacherWants.R")
source("GraphicalInterface.R")
calculateGUI()
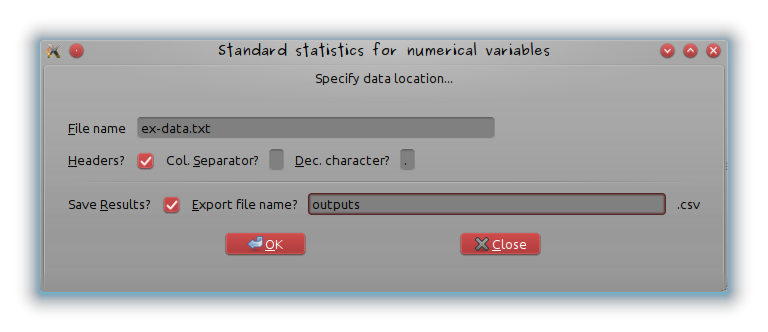
and fill the form as in the following picture:
If the data do not contain at least one numerical variable, the following error message appears:
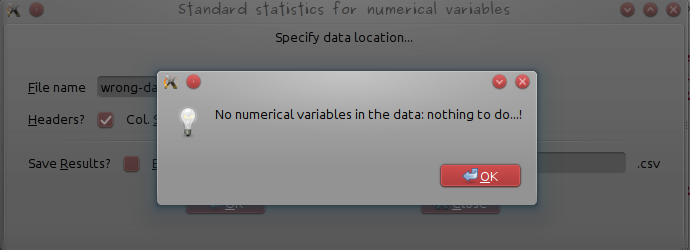
(use wrong-data.csv provided in the tutorial material for a test).
Disclaimer
To be perfectly honest, I was not really seeking at making lazy students’ life easier. My original purpose was to build a graphical interface to help geologists (and especially those from the famous NiLeDAM family) estimate the age of monazite from various elements concentration (though Dam would certainly prefer the use of the method described at this link). It’s also done 😉
