What does this package look like?
In this post, I give a very simple trick to understand the way a package is organized, which functions are included in and how these functions depend from each others. The idea has been brought by one of my student, Soraya, who is currently working in a very hostile environment, surrounded by true geeks. However, she handles the situation pretty well and manages to take the best from them. As I asked her to insert in her report a chart representing the dependency structure between her functions, she learned from them that tools existed to produce such charts automatically and was able (thanks to R blogger) to find one in an R package.
Suppose that you want to know which functions are included in the package GeneNet (that is of interest for another of my students) and to understand the dependency structure between these functions. First, download the package source, decompress it and use the subdirectory R as the working directory of your R session. If you’re on linux, the following command lines will do the job:
tar zxvf GeneNet_1.2.5.tar.gz
cd GeneNet/R
R
Then, collect and source all files located in this subdirectory and use the function foodweb (from the package mvbutils) to display the dependency structure between functions in this package:
thefiles = list.files()
sapply(thefiles,source)
library(mvbutils)
par(mar=rep(0.1,4))
foodweb(border=TRUE,boxcolor="pink",lwd=1.5,cex=0.8)
which gives the following picture:

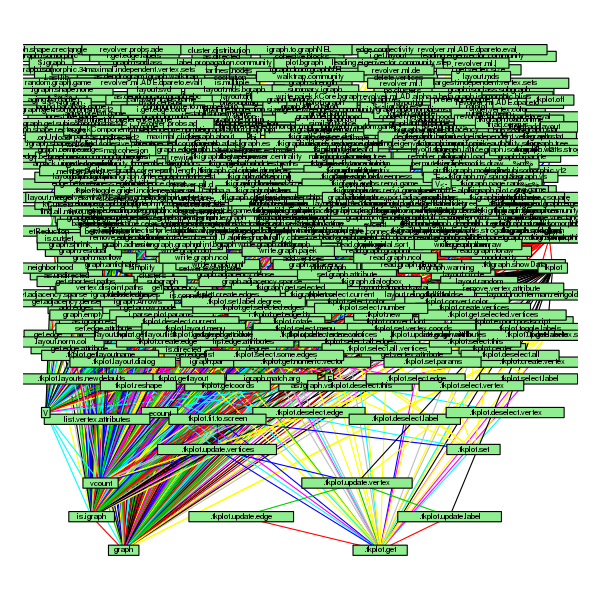
To spare my student’s time, I did the same with simone

and igraph for which I had to exclude a configuration file:
thefiles = setdiff(list.files(),"config.R.in")
sapply(thefiles,source)
library(mvbutils)
par(mar=rep(0.1,4))
foodweb(border=TRUE,boxcolor="lightgreen",lwd=1.5,cex=0.8)

I’m not sure whether the last one is very useful 😉
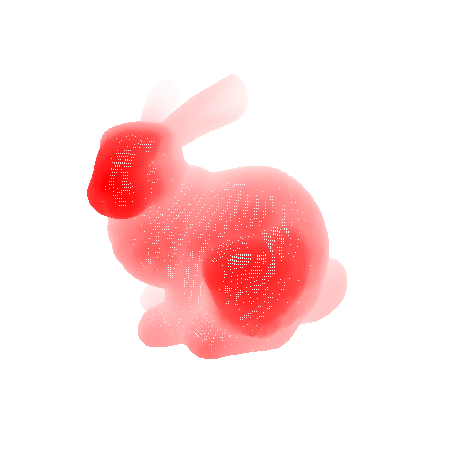
Now, Soraya is just waiting for her “warhol-R-rabbit” that Paul has promised her to include in her report. It’s gonna be a pop art variant of:

I’m really looking forward to post the R script for it!

